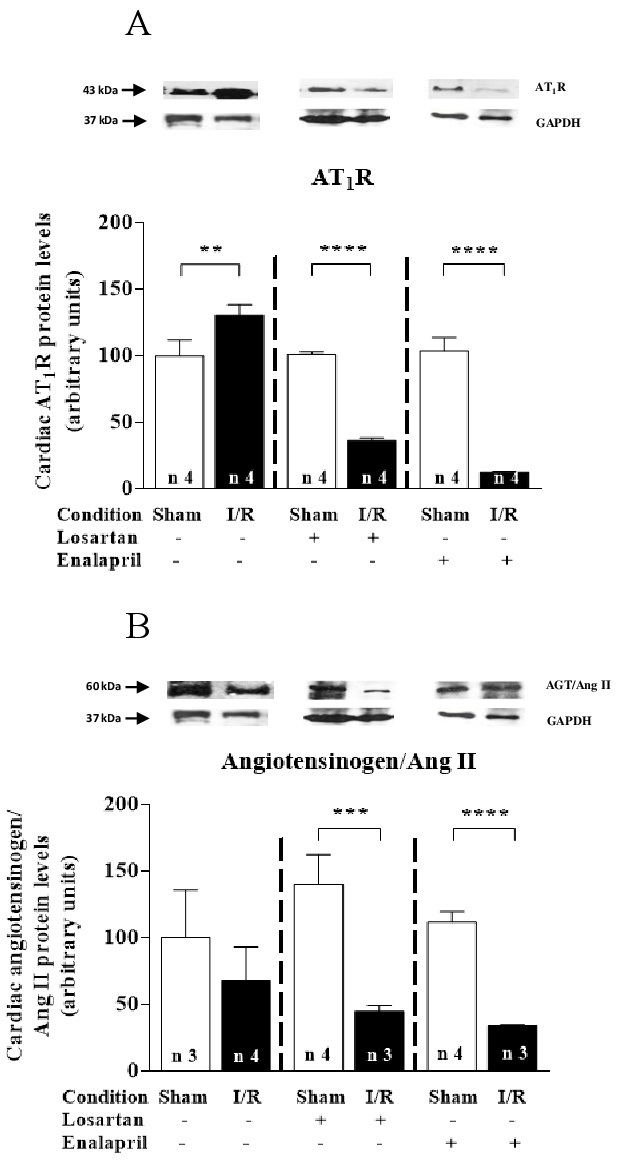
Fig. 7. Fig. 7. Ang II type 1 receptor density and angiotensinogen/Ang II level in heart tissue after renal I/R. Data are expressed as mean ± SD. The number of experiments using different preparations is indicated within or above each bar. Mice from Sham (empty bars) and I/R (filled bars) groups were treated with or without different drugs, as indicated on the abscissae. (A) AT1R abundance. Upper panel: Representative immunodetection for AT1R and glyceraldehyde-3-phosphate dehydrogenase (GAPDH) as protein loading control. Lower panel: Graphical representation. (B) Angiotensinogen (AGT)/ Ang II abundance and GAPDH as protein loading control. Upper panel: Representative immunodetection for AGT/Ang II and GAPDH as protein loading control. Lower panel: Graphical representation. **p<0.01, ***p<0.001, ****p<0.0001, as assessed using onefactor ANOVA followed by Bonferroni’s test for selected pairs. Upper bands in A (a, b, c) and B (g, h, i) show for comparison 3 different representative immunodetections developed in separate experiments. Lower bands in A and B (d, e, f) show loading controls, which were the same for A and B.